SpaceX Lands on Nasdaq: The Week Markets Remembered How to Fly | Week Ending 13 June 2026
SpaceX’s record $1.77T Nasdaq debut dominated the week, with SPCX jumping 19% on day one. Softer inflation data and Iran-related optimism helped markets recover some ground and pushed the VIX lower — but the picture remains mixed. Here’s what actually mattered for investors.

The Big One: SpaceX Goes Public
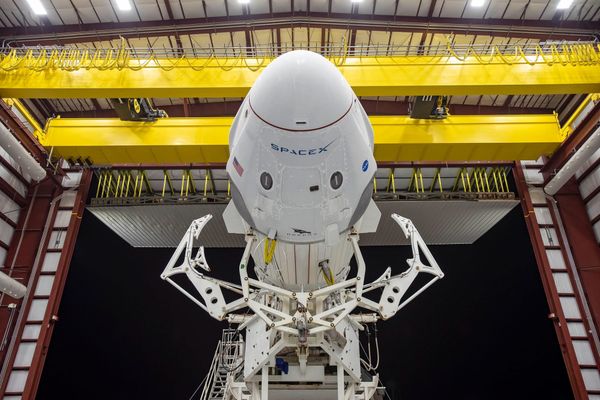
It’s the IPO that rewrote the record books. SpaceX — Elon Musk’s rocket and satellite company, now trading under the ticker SPCX — made its Nasdaq debut on Thursday, 12 June 2026, and it didn’t disappoint.
Priced at $135 per share, the float valued SpaceX at $1.77 trillion at listing — the largest IPO in market history, eclipsing Saudi Aramco’s 2019 record with room to spare. The company raised $75 billion in the offering, a capital haul that makes most corporate fundraising look like a Bunnings sausage sizzle.
Day one? SPCX closed at $160.95, posting a first-day gain of 19.22%. The event was watched globally, and for good reason: this wasn’t merely a stock listing. It was a statement that the private sector’s most ambitious technology company had arrived on public markets — and retail investors finally had a seat at the table.
What exactly did investors just buy?
SpaceX’s business is broader than most people appreciate. Yes, the rockets. But the real near-term earnings story is Starlink — the global satellite internet constellation now serving well over six million subscribers worldwide, with coverage across remote Australia, rural North America, maritime routes, and conflict zones. Starlink operates an infrastructure asset in low-Earth orbit that took over a decade and tens of billions of dollars to build. Replicating it is not a realistic short-term prospect for any competitor.
Beyond Starlink, the business spans reusable launch vehicles (Falcon 9, Falcon Heavy, Starship), government and commercial payload contracts with NASA and the DoD, and an AI and autonomous systems division that Musk has been quietly scaling. The IPO prospectus reportedly flagged Starlink’s profitability as the anchor near-term earnings driver — a genuine cash cow strapped to a long-duration infrastructure asset.
At a $1.77 trillion valuation, SpaceX sits ahead of Meta Platforms ($1.44T market cap as at 12 June) and is not far behind Amazon. Whether the price is justified depends on your view of Starlink’s total addressable market, the cadence of launch contract revenue growth, and the optionality embedded in Starship — the fully reusable heavy-lift vehicle designed to make deep space commercially viable.
Is SPCX investable at these levels?
The honest answer: not for most retail investors, at least not immediately.
At $160.95, you’re already 19% above the IPO price on day one, with no publicly available quarterly reports, no trailing P/E to anchor valuation on, and institutional allocatees positioned to sell into retail demand. The classic IPO dynamic — institutional buyers allocated stock at $135 marking to market above $160 — creates a structural overhang in the first weeks of trading.
If history is a guide (and it usually is), high-profile IPOs tend to correct 20–40% from their first-week highs before finding fundamental support. The 90–180 day lockup expiry window — when insiders and early employees can begin selling — is a particularly common inflection point. Patient investors who missed the IPO allocation often wait for that event before building positions.
The long-term thesis on Starlink infrastructure and commercial launch cadence is legitimate. This isn’t a story built on hype alone. But thesis and timing are different disciplines. Buying euphoria without anchor data is speculation, not investing. If you must have exposure now, keep the position small. This week’s Investing 101 piece on position sizing (running Wednesday) covers exactly how to think about allocations to new, volatile listings.
Collateral damage: the space sector got rattled
SPCX’s debut acted as a capital vacuum. Rocket Lab (RKLB) dropped 10.80% on the week as investors rotated out of the small-cap space proxy and into the newly accessible giant. AST SpaceMobile (ASTS) fared worse, falling 15.53% — a brutal outcome for a stock already under pressure.
For Aussie investors holding RKLB: the structural story (smaller payloads, responsive launch, sovereign launch capability for US allies) hasn’t changed, but SPCX’s listing adds a competitive and capital allocation overhang that didn’t exist a week ago. RKLB needs to lean into its niche more visibly. Watch their next launch cadence updates and any contract announcements closely — that’s what differentiates them from “a worse SpaceX.”
If you hold a space-themed ETF or satellite names alongside US large-caps, this week illustrates single-theme concentration risk even when the underlying stories differ. Capital can still rotate aggressively toward the highest-profile name in the sector, pressuring the rest of the basket regardless of individual fundamentals. This is worth factoring into position sizing and correlation assumptions, particularly for Australian investors already running USD and single-stock concentration risk on top of the theme exposure.
Broader Markets: Recovery Mode Engaged
The SpaceX spectacle aside, the broader market had a genuinely constructive week.
The S&P 500 closed at 7,431.46, up 0.50% on Friday alone and building on a positive week that partially reversed the prior week’s jobs-driven selloff. The Dow Jones Industrials closed at 51,202.26, up 0.70% Friday. The Nasdaq settled at 25,888.84, up 0.31% — solid given the index’s sensitivity to rate expectations. And the Russell 2000 — the small-cap barometer — climbed 0.79% to 2,943.99, confirming that risk appetite was broadening beyond mega-cap tech.
Two macro catalysts drove the recovery.
Iran peace deal expectations. WTI crude oil fell 3.90% to $84.29 on growing optimism around US-Iran diplomatic talks. If a deal materialises — and that remains a significant “if” — the implied supply increase would push energy prices meaningfully lower, acting as a disinflation tailwind for both the US economy and Australian consumers. Markets are pricing in some probability of progress, not a certainty. Watch this space carefully.
Softer inflation data. This week’s consumer price prints came in below expectations, giving the Federal Reserve cover to maintain its data-dependent stance without being forced into further hawkish rhetoric. That’s not the same as confirmed rate cuts, but for a market still recovering from the prior week’s payrolls shock, it was enough oxygen.
Gold had a standout week, climbing 3.06% to $4,239.90 per ounce. The gold bull thesis currently runs on multiple rails simultaneously — geopolitical risk hedging, real rate trajectory, and central bank accumulation. A +3% week while equities also rallied suggests demand is broad-based, not just fear-driven. Aussie gold equity investors (Northern Star Resources, Evolution Mining on the ASX) would have had a strong Friday.
VIX fell 9.05% to 17.68. The fear gauge deflating meaningfully is a positive signal. Institutional options desks pricing in less short-term volatility creates room for risk assets to extend their recovery. A VIX below 20 is historically associated with constructive market conditions — and below 18, where we now sit, has preceded some of the market’s strongest sustained runs.
The Jobs Hangover — and the Inflation Antidote
Context matters. To understand this week’s relief rally, you need last week’s gut punch.
The week ending 6 June delivered a sharper-than-expected Non-Farm Payrolls print: 172,000 new jobs, above consensus estimates. Strong employment data flips the Fed rate cut narrative on its head. If the labour market is running hot, inflation can re-accelerate, and the Fed has no incentive to ease. That fear hit rate-sensitive growth stocks hard — the Nasdaq bore the brunt, and the VIX spiked accordingly.
This week’s softer CPI data was the partial antidote. Inflation printing below expectations doesn’t guarantee cuts, but it defuses the “no cuts ever” panic and restores the “patience is working” narrative. The Fed’s preferred scenario — cooling inflation without a dramatic labour market deterioration — remains in play.
The University of Michigan Consumer Sentiment survey (preliminary June reading) came in at 48.9, up from 44.8 the prior month. Improvement noted, but the context demands honesty: historically, readings below 50 are associated with recessions and economic distress. Consumers are still rattled by cumulative inflation, housing unaffordability, and global uncertainty. That depressed sentiment feeds into weaker discretionary spending, which flows through to retail earnings eventually. The market may be getting ahead of itself on consumer health.
The bottom line: data is mixed, directionally improving, but nowhere near “all clear.” The patient investor acknowledges both the tailwind and the residual fragility.
Stock Movers Worth Noting
Intel (INTC): +6.51%
Intel had a meaningful week without a dominant single catalyst. The market appears to be gradually repricing Intel’s foundry ambitions — CEO Pat Gelsinger’s long-shot, capital-intensive bet on third-party chip manufacturing. It’s early, the risk remains high, and Intel faces formidable competition from TSMC and Samsung in the foundry race, plus NVDA and AMD in the AI chip arms race. But momentum traders found something to like this week. INTC reports next earnings in late July. Revenue stabilisation — not growth, just stabilisation — is the threshold question for the stock to sustain this move.
Roku (ROKU): +20%
That’s not a typo. ROKU surged 20% in a single week — a significant move for a stock that’s been grinding sideways for years. No confirmed catalyst at time of writing. The move may reflect an analyst upgrade with strong conviction, M&A speculation, or a technical breakout through key resistance. Roku’s distribution footprint — over 100 million active accounts — remains genuinely valuable in the streaming aggregation wars, even if its own content and hardware strategy has disappointed. The question is whether this move holds through rebalancing flows at month-end, or fades. Worth watching.
What Aussie Investors Should Watch Next Week
1. SPCX price action. The first full trading week will reveal where institutional conviction sits and whether the retail-driven first-day pop has legs. A pullback toward the $140–150 range wouldn’t be surprising — and might represent a better-anchored entry for patient, long-thesis investors.
2. Federal Reserve communications. With conflicting data signals (strong jobs vs. soft inflation), any Fed speaker commentary on the rate trajectory will move markets. The stakes are unusually high ahead of Kevin Warsh’s first FOMC meeting on 16–17 June, with the press conference on the 17th. Markets will be watching closely for any shifts in tone or guidance under the new Chair. A single hawkish or dovish phrase can still reprice the rate cut (or hike) calendar and hit growth stocks within hours. Note that while former Chair Powell remains on the Board as a Governor, his comments now carry less immediate market impact than they did previously.
3. Crude oil and Iran. This is a binary event. A confirmed diplomatic breakthrough sends oil toward $75–78 and adds fuel to the equity recovery. A breakdown reverses both. Consider your energy sector exposure — both long (oil producers, energy ETFs) and indirect (airline stocks, logistics names that benefit from cheaper fuel). Position accordingly.
4. AUD/USD. Sitting at approximately 0.7050, the Aussie dollar is in a pivotal zone. Any hawkish Fed repricing strengthens the USD and depresses the AUD, magnifying losses on USD-denominated US equity positions for Aussie investors. You’re not just running stock risk when you buy US equities — you’re running FX risk too. When AUD/USD moves 5%, it can halve a modest equity gain or double a modest loss. Our Investing 101 piece this Wednesday covers exactly how to factor AUD/USD into position sizing — it’s the risk multiplier most Aussie investors miss entirely.
5. US corporate earnings season approaches. Both Microsoft and Meta report earnings on 29 July 2026 — just six weeks away. Markets will start positioning ahead of these prints within the next fortnight. For Aussie investors holding either name (or ETFs with heavy concentration in both), it’s worth reviewing your position size now rather than chasing or cutting in a post-earnings gap. Watch for any pre-earnings guidance commentary from management, particularly around Azure growth trajectory and Copilot adoption rates. Sentiment can move significantly on a single earnings call.
6. Microsoft (MSFT) — Monday’s Stock Spotlight. The AI hyperscaler CapEx arms race is this year’s defining investment theme. Hyperscalers — Microsoft, Google, Meta, Amazon — are collectively committing over $320 billion in infrastructure spending for calendar 2026. Microsoft alone is targeting approximately $80 billion. At $390.74 (approximately A$554.60), MSFT is down 19.21% year-to-date despite posting 18% revenue growth and 39% profit margins in its most recent quarter. Azure is growing 35–40% year-on-year. Is the pullback a value entry or a capital-destruction story in slow motion? We dig in Monday. Don’t miss it.
Wall St. Down Under | Australia
Subscribe | wallstdownunder.com.au
Disclaimer: Wall St. Down Under is an independent financial newsletter for informational and educational purposes only. Nothing published here constitutes financial advice, a recommendation to buy or sell any security, or a solicitation of any investment decision. Always do your own research and consult a licensed financial adviser before making investment decisions. Australian investors should consider their own financial situation, objectives, and risk tolerance. Past performance is not indicative of future results.